Live readings from thousands of USGS and NOAA gauges — water level, discharge, flood stage, and trend direction. And now, for the rivers and creeks that have no gauge anywhere near them, an estimated flow and 10-day outlook modeled by NOAA.
Only about 12,000 rivers in the U.S. have a sensor in the water. The creek behind your house, the section below the dam, the gorge run — most of it has had nothing. You don't need a weather station in your yard to get a forecast. Now the same is true for rivers.
River Stretches · 01
Zoom in and the rivers draw blue on the map. Tap any one of them and RiverTrax shows its estimated flow right now and which way it's trending. Name it the way you talk about it — "Below the dam," "The gorge section" — and save it next to your favorite gauges.
River Stretches · 02
See where a stretch sits now, where it has been, and where the model says it's headed for the next 10 days — recent and outlook on one chart. Pin a nearby reference gauge and RiverTrax translates the estimate into the height that gauge would read in feet, with the gauge's real measurement beside it so you can judge the model yourself.
A big river running steadily gets a single estimate — "≈ 509 CFS" — because that's what the model can honestly support there.
A small creek, or any water a storm is pushing around, gets a range — "≈ 44–66 CFS" — the same way a forecast gives you a chance of rain instead of a promise.
When the model's output can't be trusted, RiverTrax says "estimate unavailable" instead of showing you a confident wrong number.
Stretch conditions come from NOAA's National Water Model — the federal system that simulates flow on every river and creek in the country, updated continuously. Estimates are always labeled Estimated, always attributed to NOAA, and always marked with ≈. Gauges are the measurement; stretches are the forecast. A plain-language explainer built into the app — How This Works — covers where every number comes from, what a gauge actually measures, and how much to trust each one.
Whether you're planning a float, scouting flows before a drive, or watching a gauge near your property — RiverTrax gives you the data that matters.
Check discharge, gage height, and trend direction before you drive two hours to the river — on the gauges, and on the water in between them. Know when conditions are right before you load the truck.
See current discharge in CFS and whether it's rising or falling. Set a good range on a stretch and see it shaded right on the 10-day chart. Get to the put-in when flows are in your sweet spot — not at flood stage, not too low to float.
Monitor gauges near your property. Know when to move vehicles, check drainage, or call for help — before water gets where it shouldn't.
Feature 01
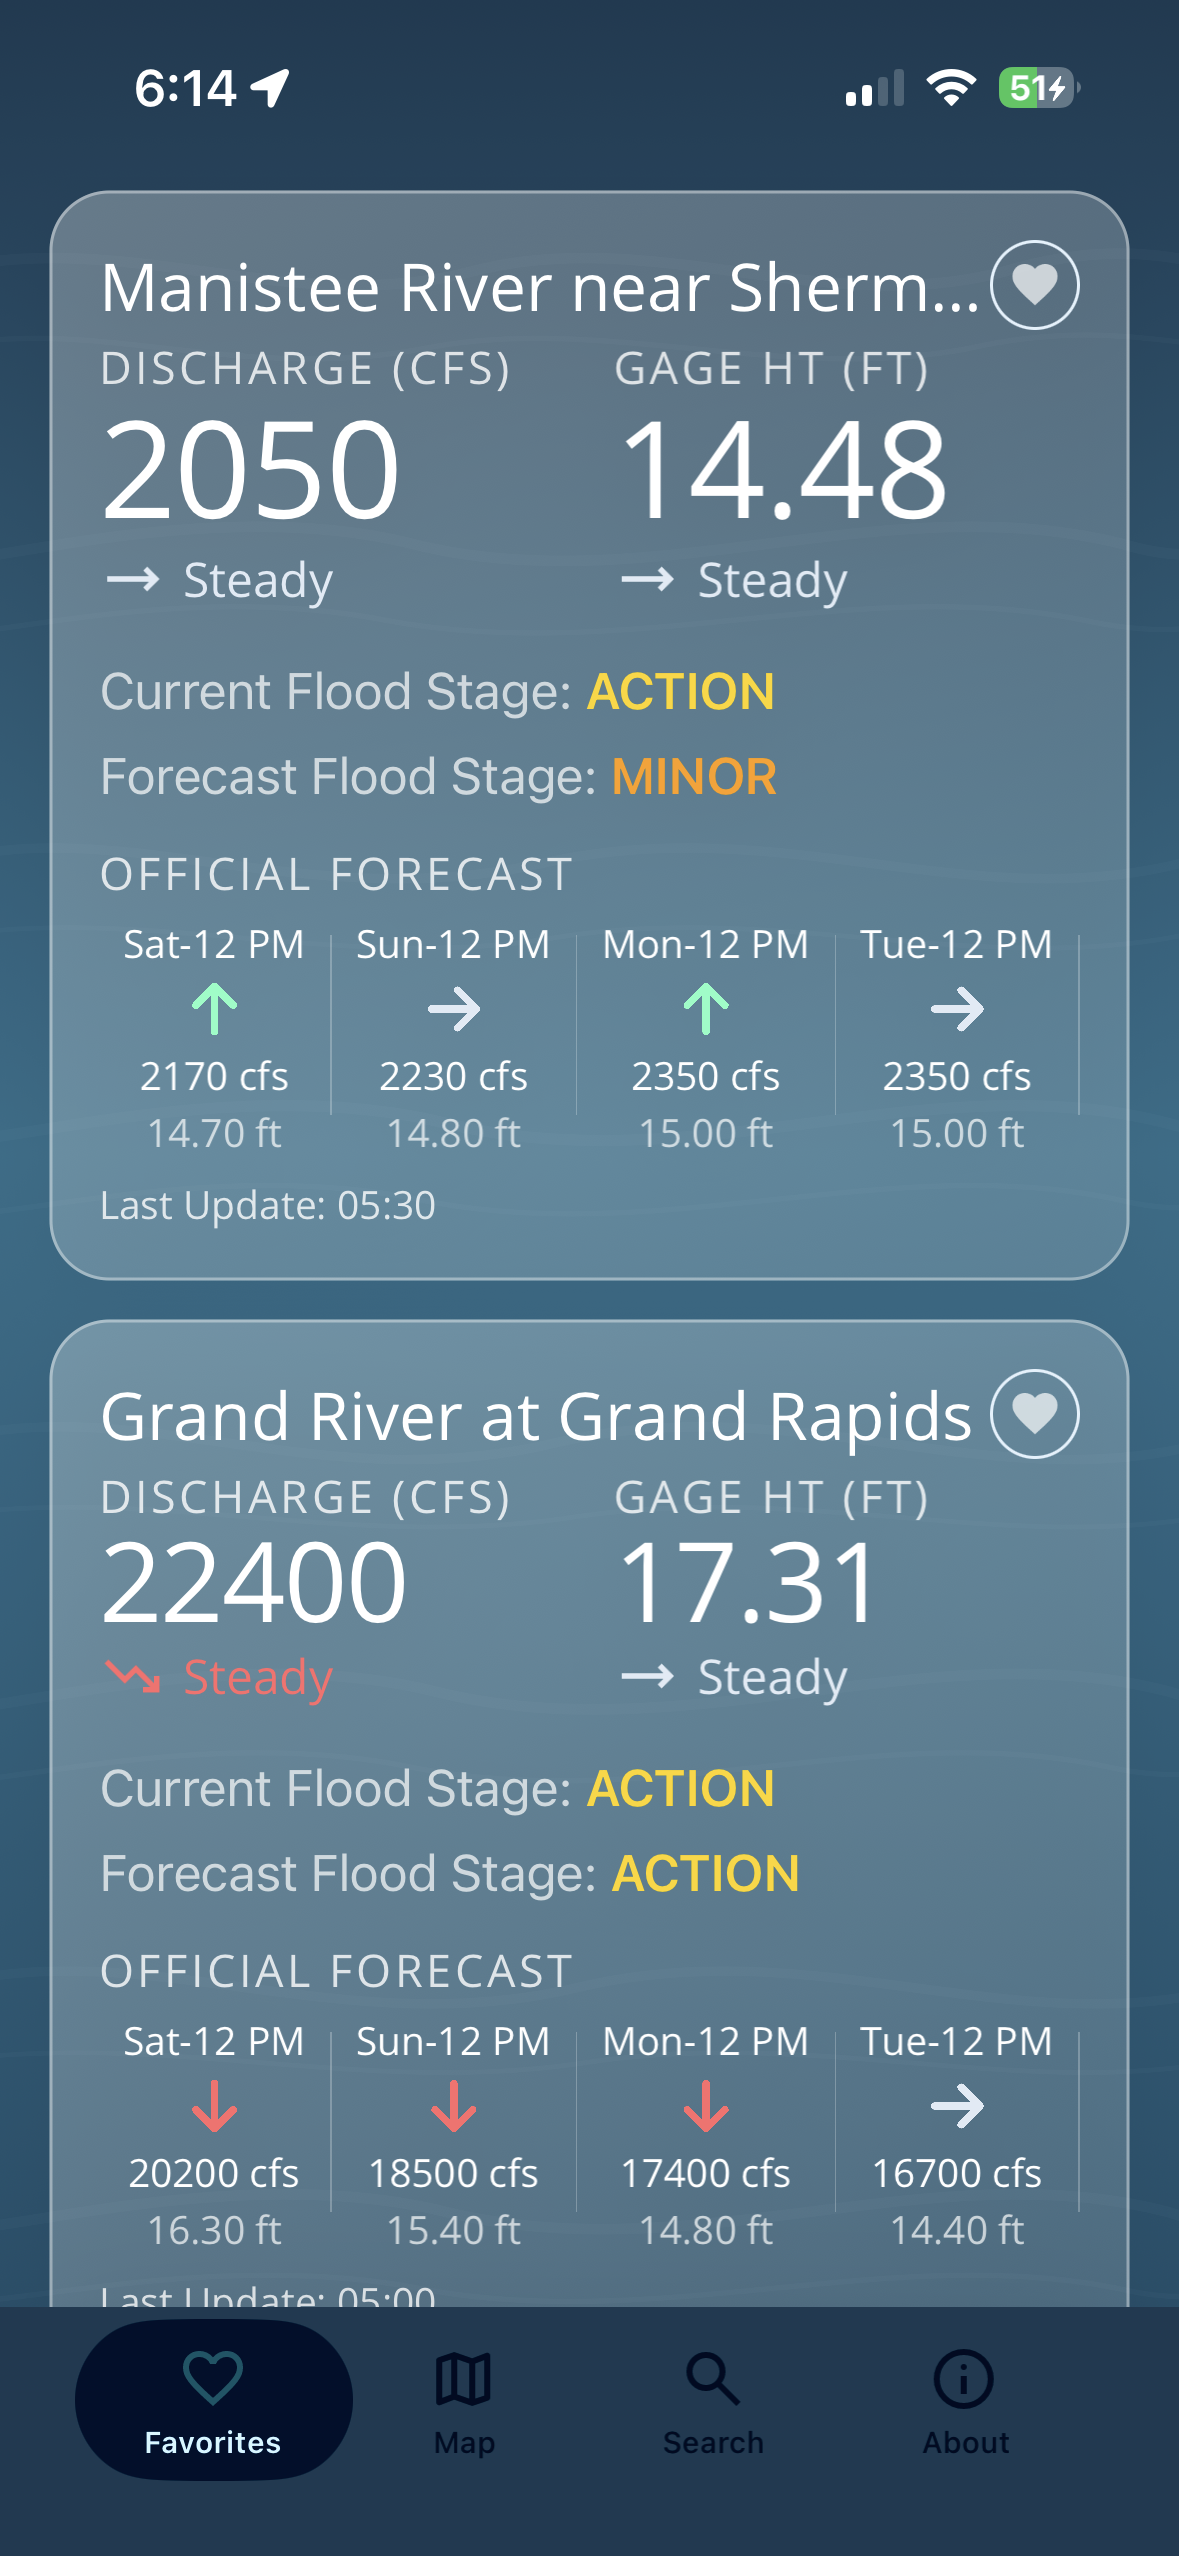
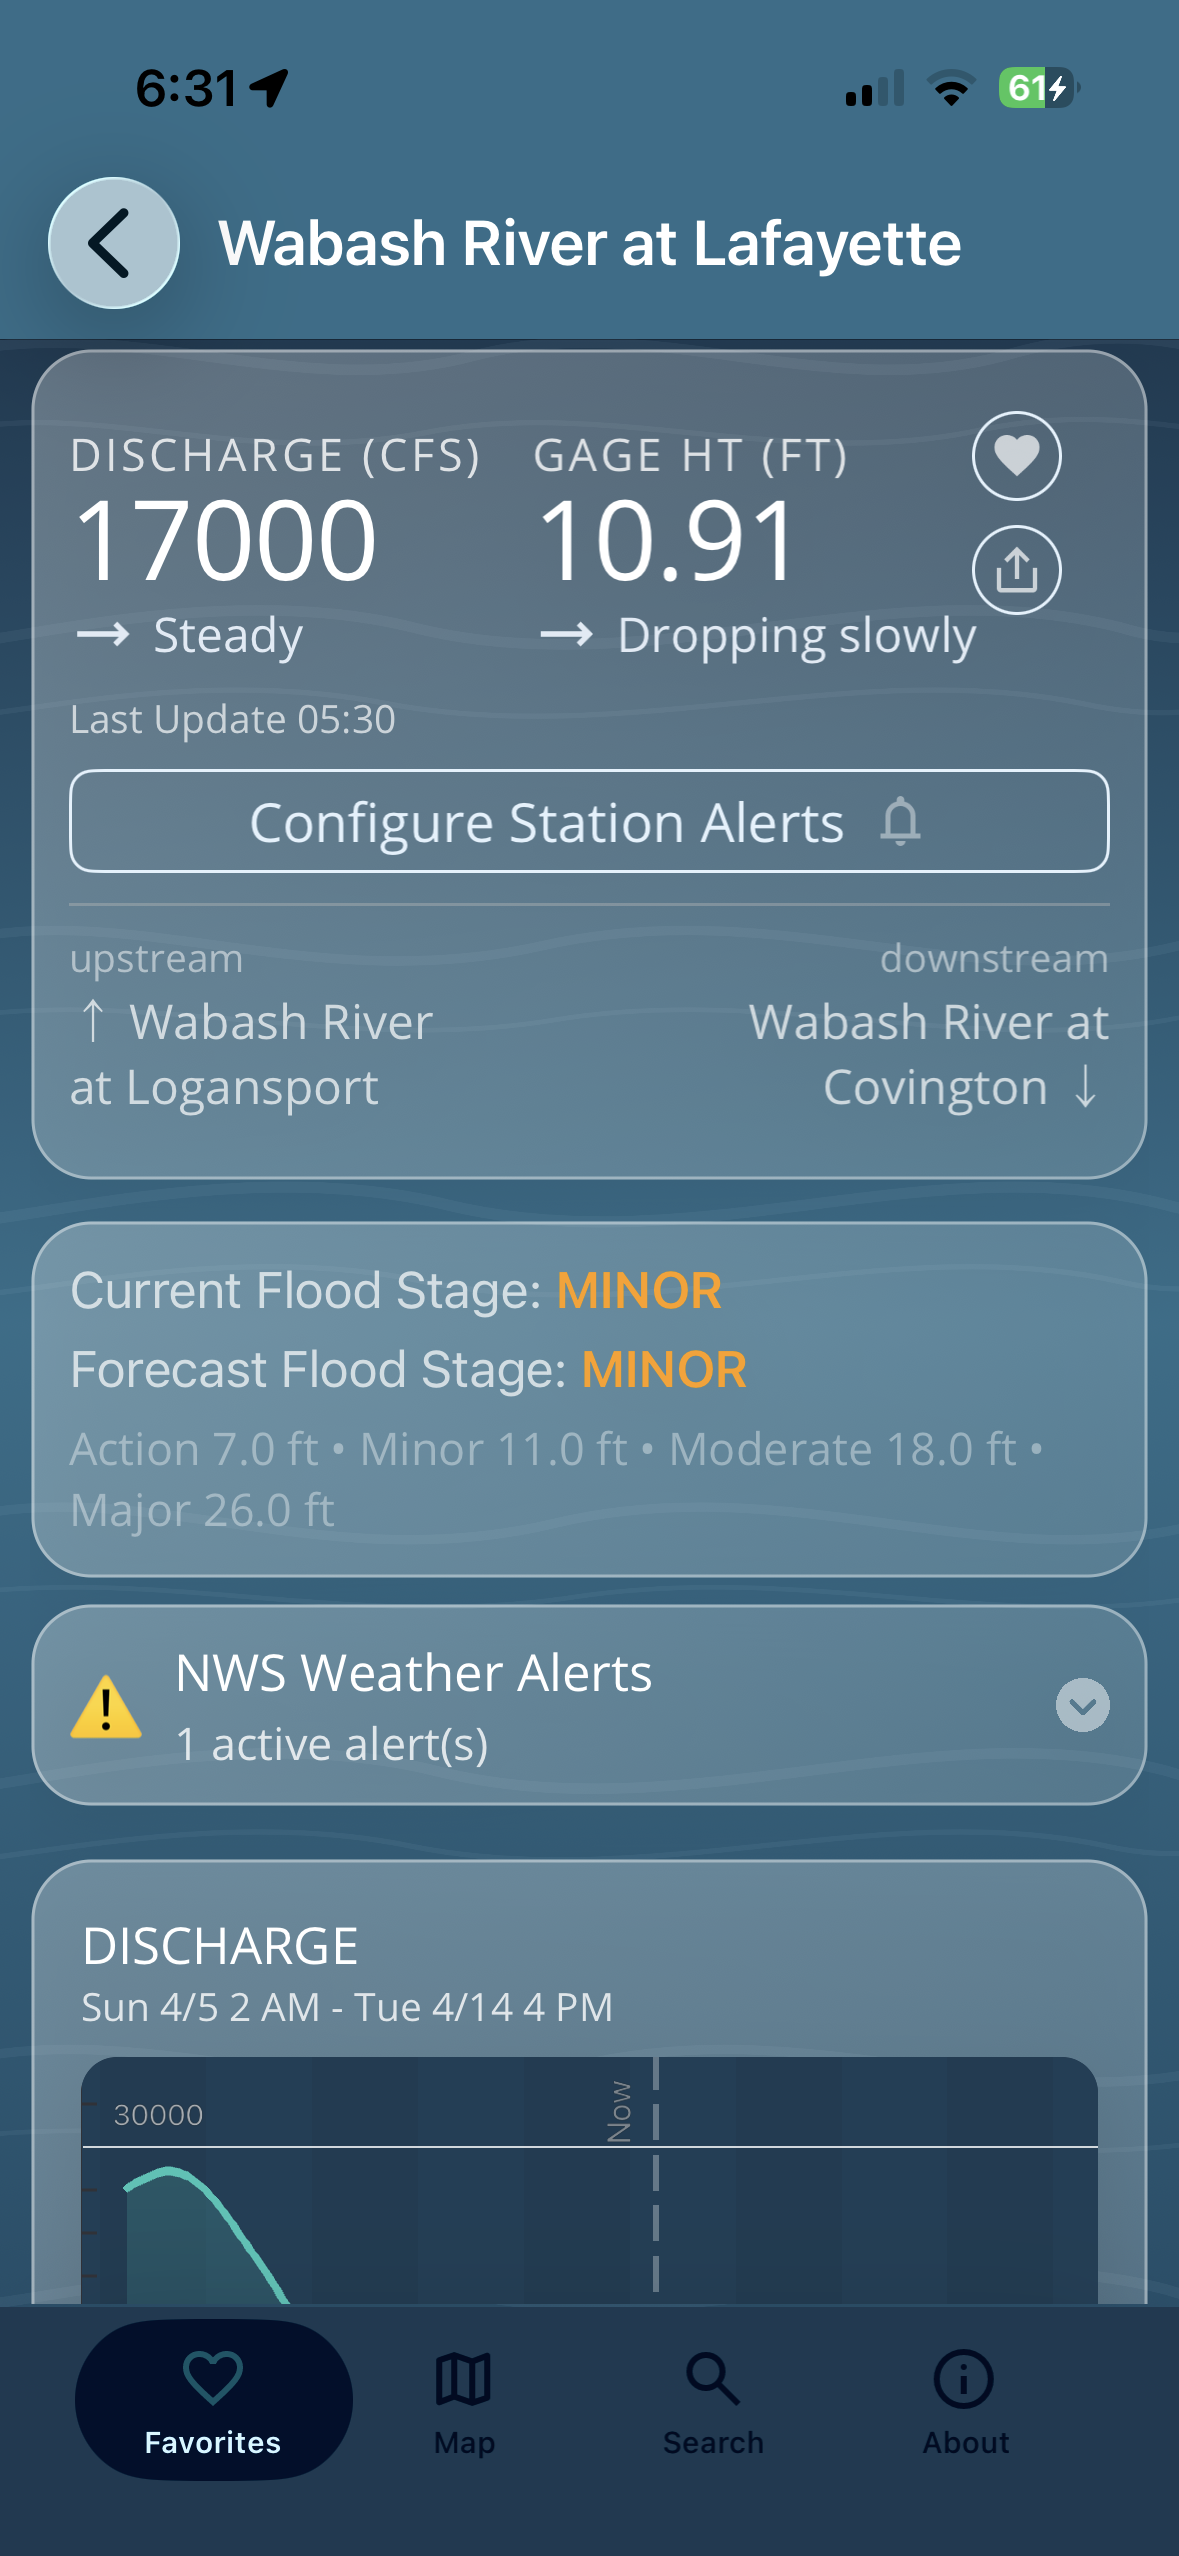
RiverTrax pulls live readings from thousands of NOAA and USGS monitoring stations. Water level in feet, discharge in CFS, flood stage classification, and trend direction — all in one place, updated continuously. Navigate directly to upstream and downstream gauges from any station to follow conditions along the watershed.
Feature 02
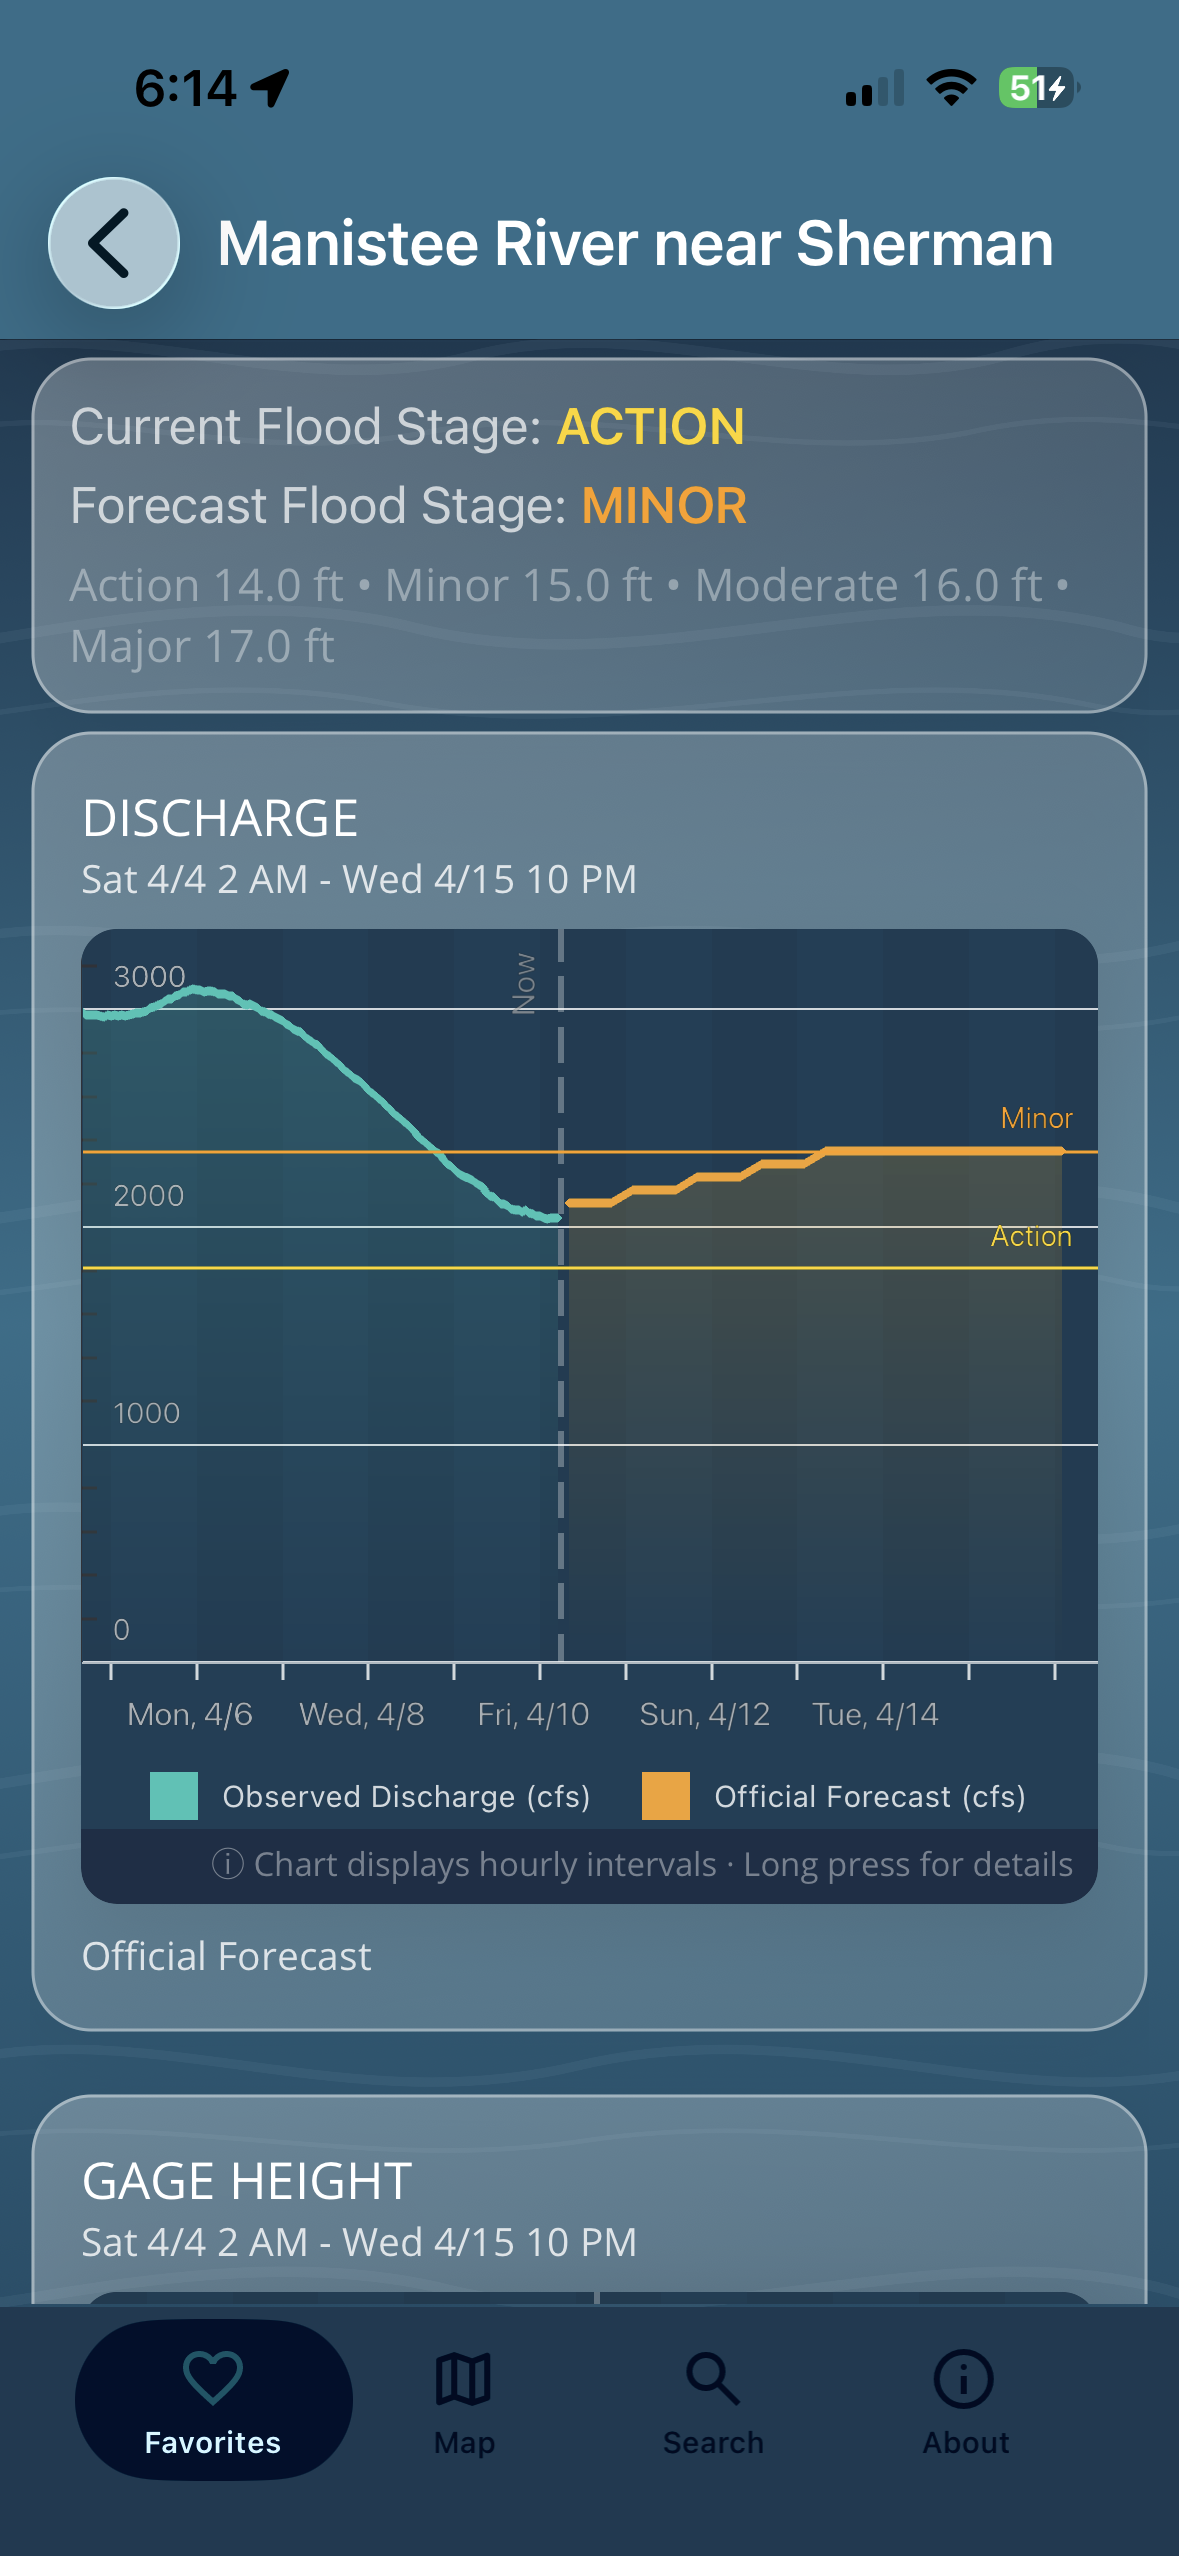
See observed discharge plotted alongside official NWS forecasts on a clean timeline chart. Flood stage thresholds — Major, Moderate, Minor, and Action — are drawn right on the chart so you can see where the river stands relative to what actually matters. Tap once for the extended 10-day outlook.
Feature 03
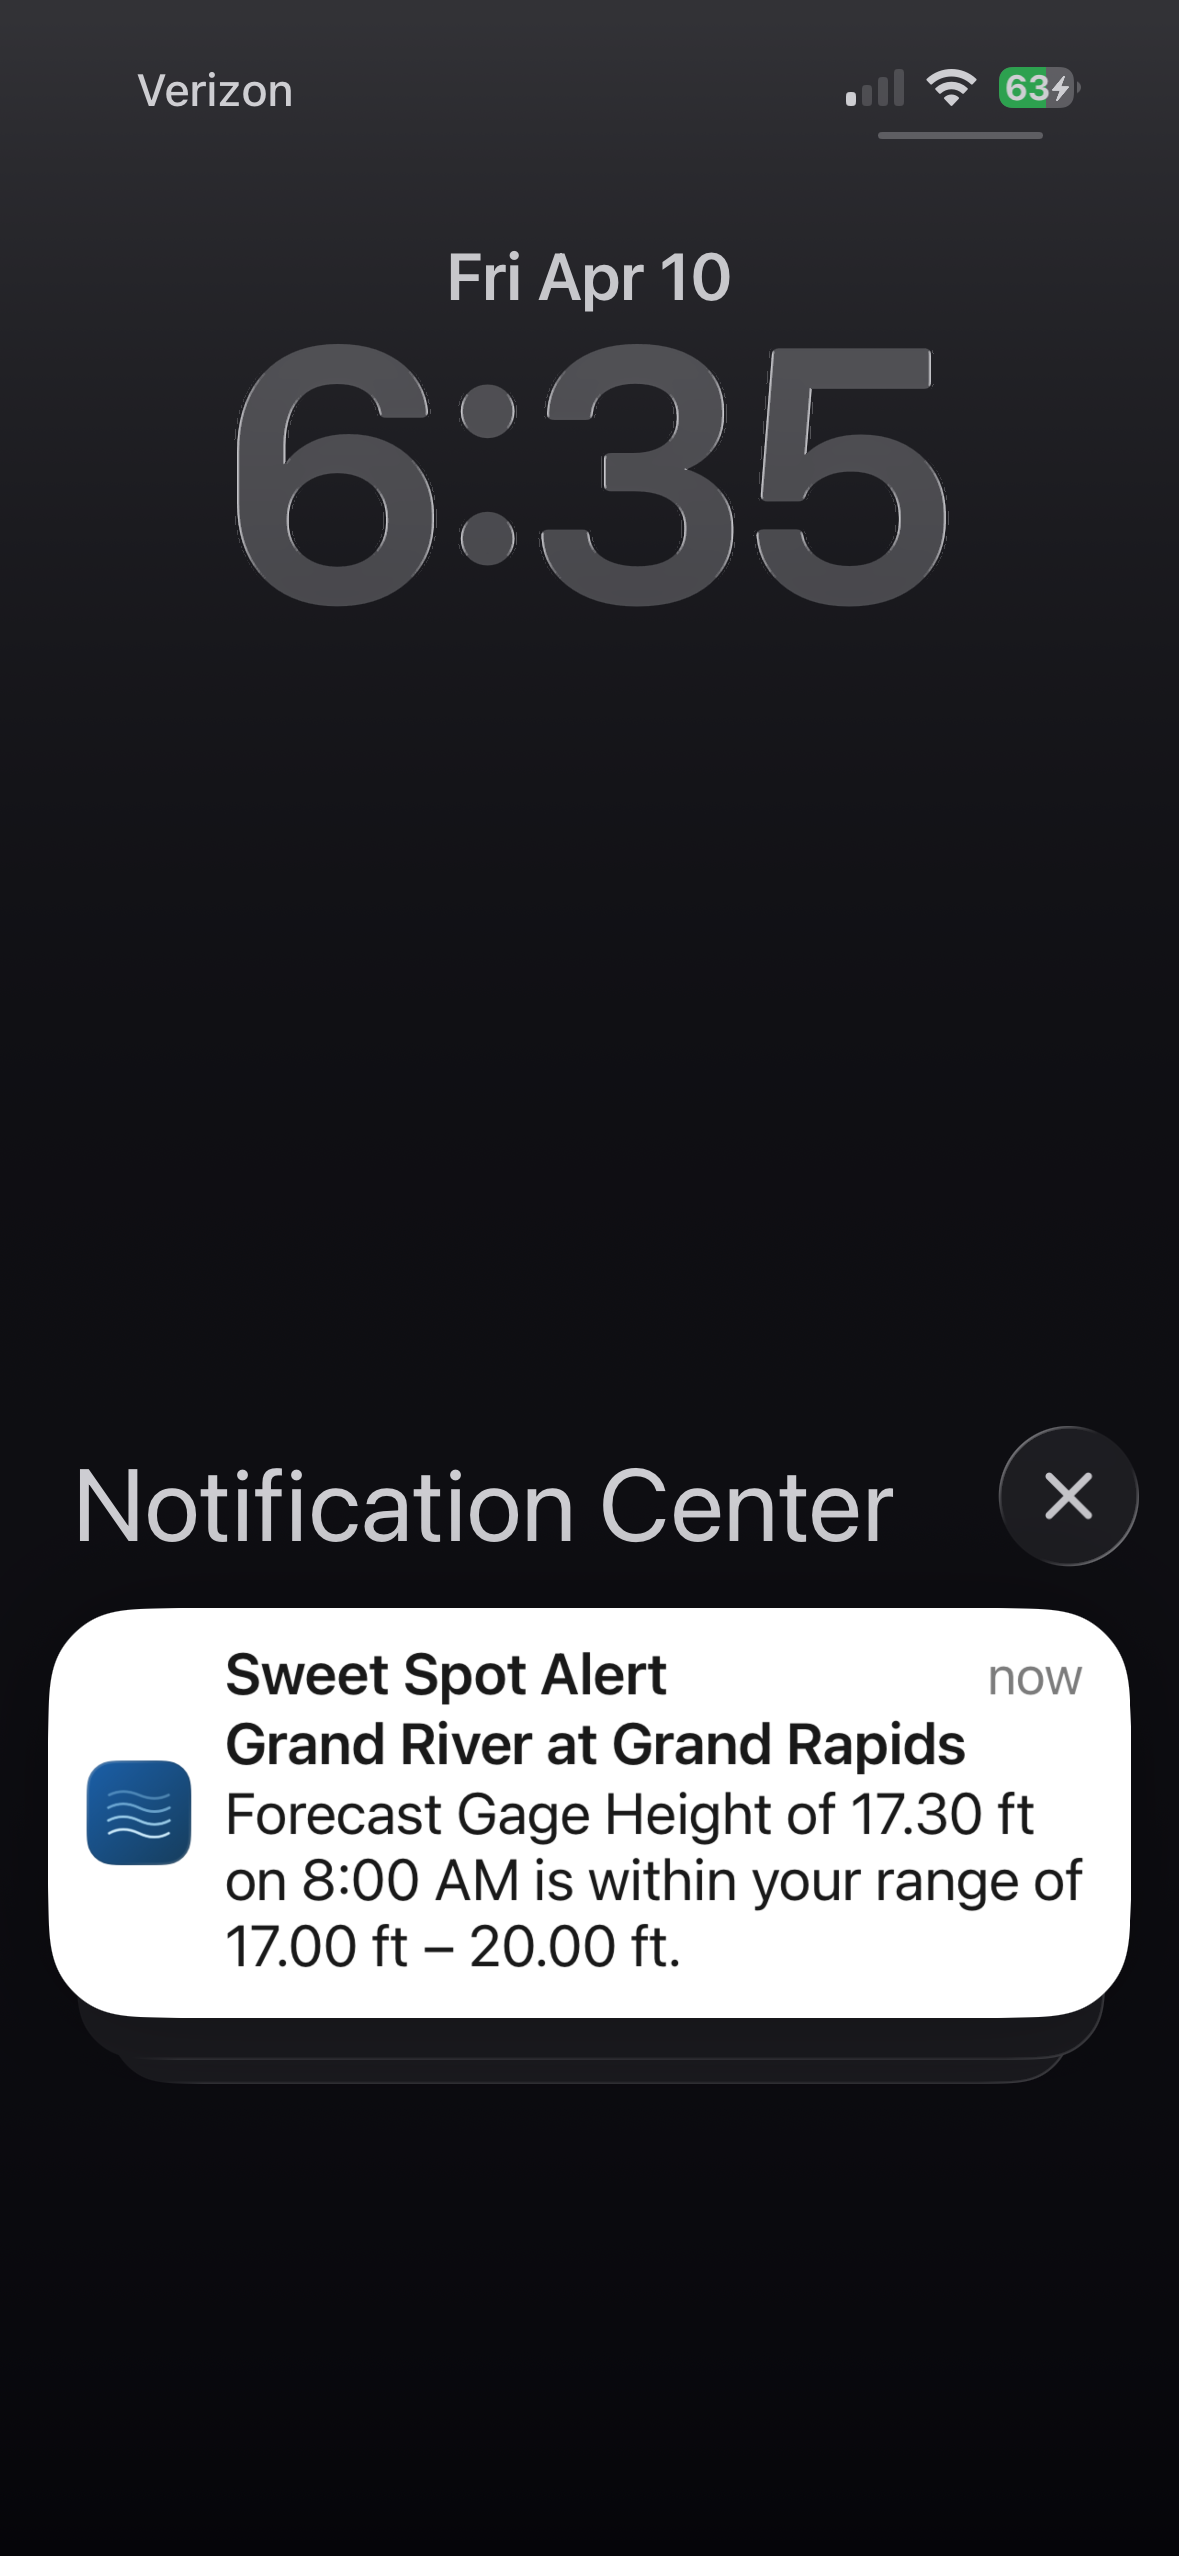
Set it once. RiverTrax monitors your stations around the clock — live readings and NWS forecasts — and notifies you when your threshold is crossed. The screenshot above is real: a forecast warning and a flood confirmation, delivered automatically to the same phone while the Kaskaskia was rising.
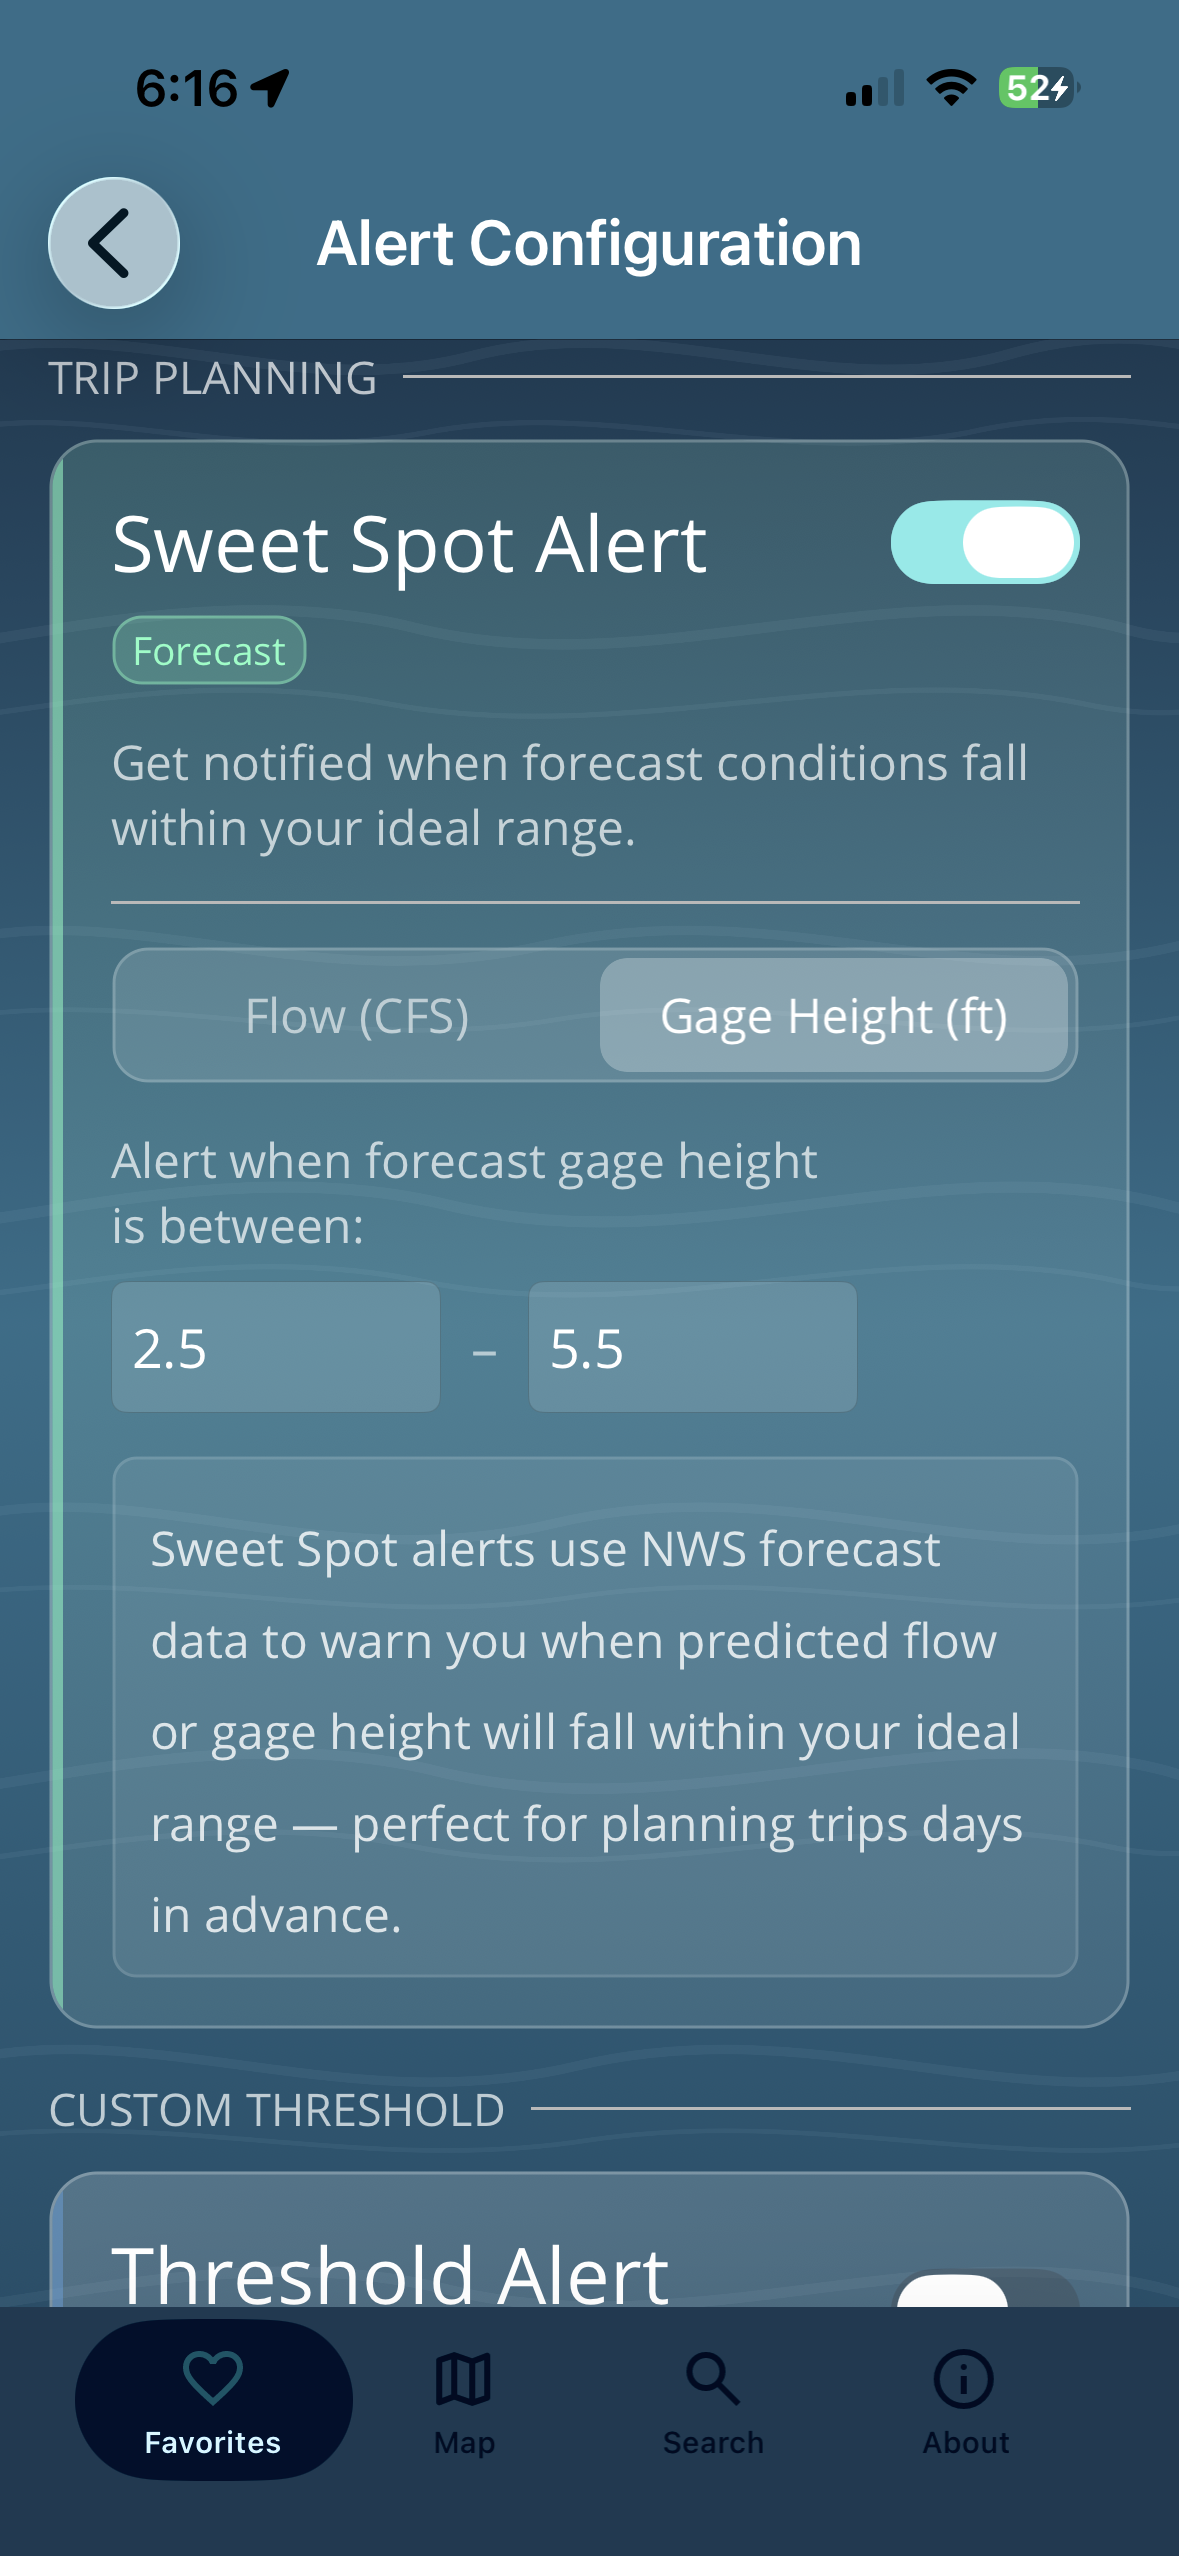
Above: Sweet Spot Alert — notified when the forecast hits your ideal range
Feature 04 · Only on RiverTrax
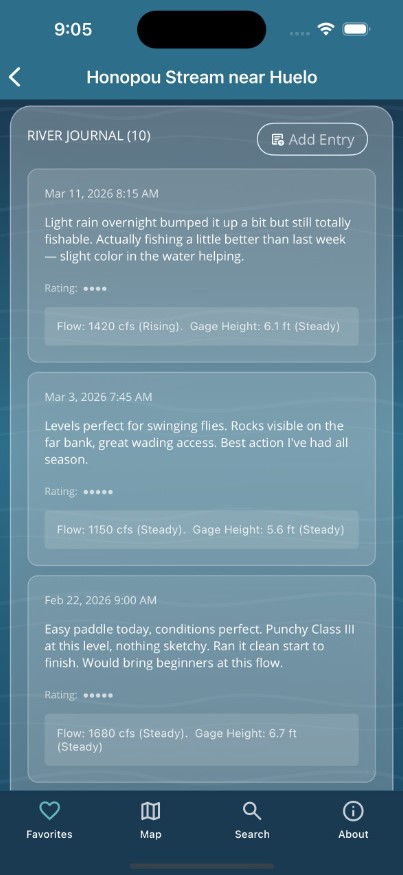
Write a note on any gauge or stretch and RiverTrax automatically stamps it with the exact conditions at that moment — discharge, gage height, and rate of change. Build a personal history of every run, scout trip, or flood event. No other river app has this.
Feature 05
Pin your favorite gauges to the iPhone home screen or lock screen. Live discharge, gage height, trend direction, and recent history at a glance — no app to open. Tap a widget and you land on that station.
Five alert types. Any station. Fully configurable — flood stage, discharge, gage height, or your personal Sweet Spot range, above or below any threshold you set.
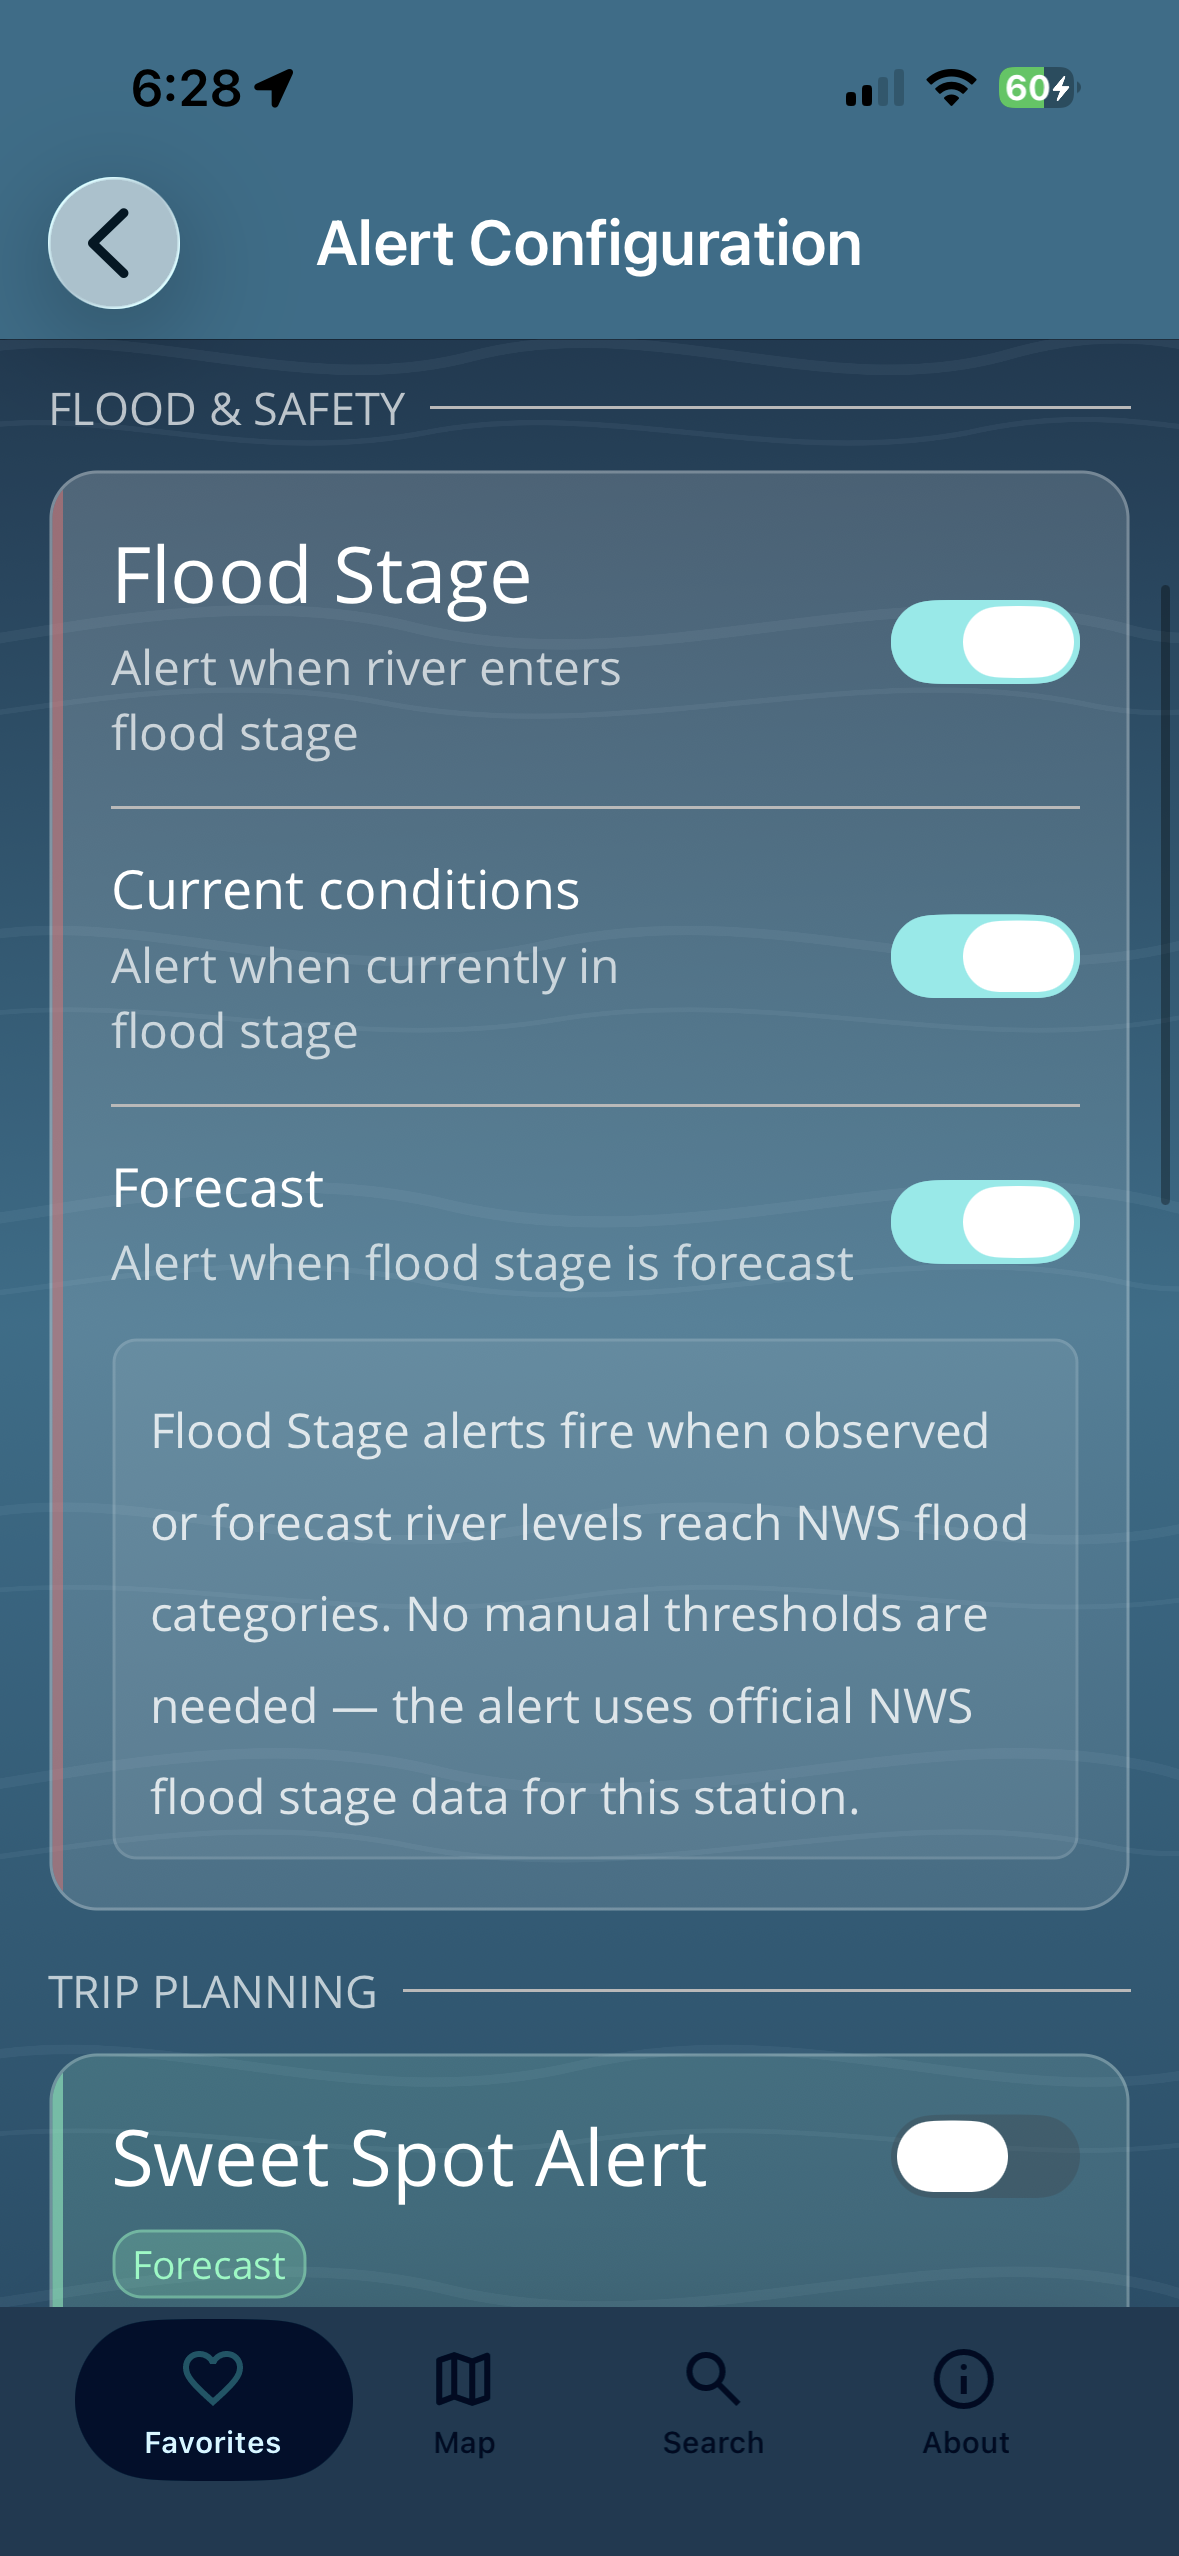
NWS flood stage thresholds are built in — Action, Minor, Moderate, and Major. Monitor current conditions or forecasted flood stage without having to look up the numbers yourself.
Set an alert when flow is above, below, or between a range in cubic feet per second. Great for knowing when your run is in optimal range — or dangerously high.
Monitor exact water level in feet. Works with the same above / below / between logic as discharge — per station, per measurement type, fully independent.
RiverTrax doesn't just check what the river is doing now — it checks what the NWS forecast says it will do. Get a warning before dangerous conditions develop, not after.
Set a minimum and maximum flow or gage height — your ideal paddling window, fishing conditions, whatever your sweet spot is. RiverTrax watches the NWS 5-day forecast and notifies you when conditions are predicted to fall in your range. Know days ahead, not the morning of.
No account. No setup. Find your water, check conditions, and go.
Search any USGS or NOAA gauge by river name, location, or state — or tap a river on the map that has no gauge at all. Save either one to your favorites.
Measured water level, discharge in CFS, flood stage, and trend direction on a gauge — or an estimated flow and 10-day outlook on a stretch, clearly labeled Estimated.
Configure a threshold and RiverTrax notifies you when conditions hit your mark — no more checking manually.
Live conditions on thousands of gauges, and estimated conditions on the water in between. Free on the App Store, no account required.
Download on the App StoreFree · iOS 16+ · iPhone only